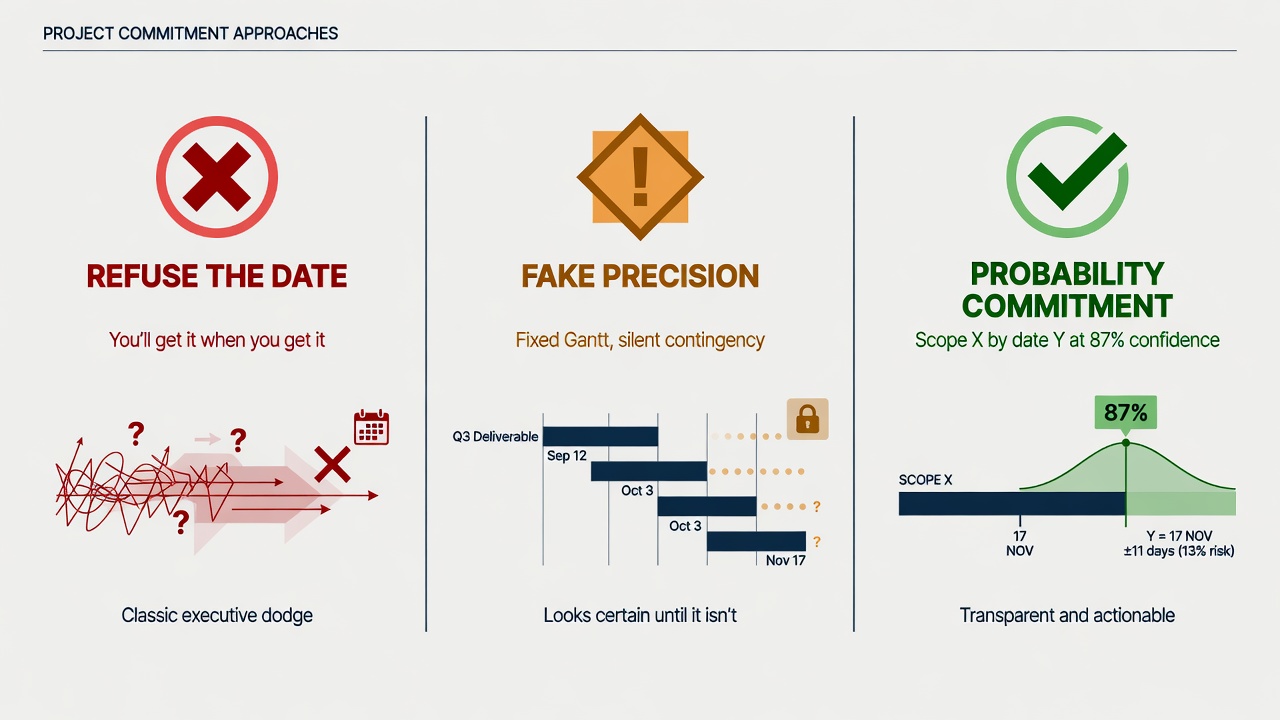
"We're Agile" has become a respectable way to refuse a date. Programme boards still need to know what will and will not ship before the next regulatory window, product launch or capital commit. Transformation sponsors still get asked for commitments in language executives understand. The honest move is not to invent a single ship date with silent contingency. It is to trade false certainty for an explicit likelihood: feature X by date Y with roughly 87 per cent confidence, grounded in how the team actually finishes work.
Waterfall-trained organisations often hear Agile as permission to stop committing. That reading is convenient and wrong. Agile changes the unit of planning, the length of the feedback loop and the honesty of the forecast. It does not delete the need for a prioritised list of outcomes or for a defensible answer to "when".
What Agile actually changes (and what it does not)
What changes is the shape of the promise. You stop freezing a twelve-month work breakdown that pretends uncertainty has been removed. You start working a ranked backlog. You ship increments often enough that product and business can steer. You update the forecast as delivery data arrives.
What does not change is accountability. Someone still owns the outcome. Someone still decides what is in and out of scope when the probability of hitting a date falls. Regulators, boards and counterparties still live on calendars. Calling the programme Agile does not make those calendars optional.
The failure mode in banks and insurers is predictable. Leadership adopts ceremony names, keeps waterfall governance calendars and then treats any request for a date as anti-Agile. Delivery teams protect themselves with "it depends". Sponsors fill the vacuum with Gantt theatre: one diamond milestone, one green bar and a risk register nobody believes. Nobody is lying in the dramatic sense. Everyone is using a planning language that cannot express uncertainty without looking incompetent.
The minimum operating system
Three things are non-negotiable.
First, a prioritised list of outcomes and the work that realises them. If everything is P1, nothing is. Priority is a product and business decision, not a negotiation between squads about whose ticket is louder.
Second, product and business feedback every sprint (or equivalent short cadence). Forecasts without steering are still theatre. If the people who can cut scope or change acceptance criteria only appear at PI boundaries, you will burn sprints on the wrong work and then blame the forecast.
Third, express likelihood by date. "We'll do our best" is not a forecast. "Done by Thursday at ~87 per cent confidence, given current scope and historical throughput" is a forecast someone can manage against. Lower the confidence and you can often pull the date forward or grow the scope. Raise the confidence and you usually need more time, less scope or more capacity. That is a management conversation, not a religion.
From initiative to executable work
Large programmes still need a coarse planning horizon. PI planning or big-room planning is useful when it produces a ranked set of outcomes for roughly the next three months, with T-shirt sizing good enough to allocate capacity and surface dependencies. It is not useful when it freezes a pseudo-waterfall plan dressed in Agile vocabulary.
After the coarse pull, teams groom the near-term work into stories, apply story points (or another consistent relative size) and execute in sprints. Predicted versus actual then becomes the raw material of forecasting. The point of story points in this model is not mystical precision. It is a stable relative scale so that "we finished 34 points last sprint" means something comparable to the sprint before, provided hygiene holds.
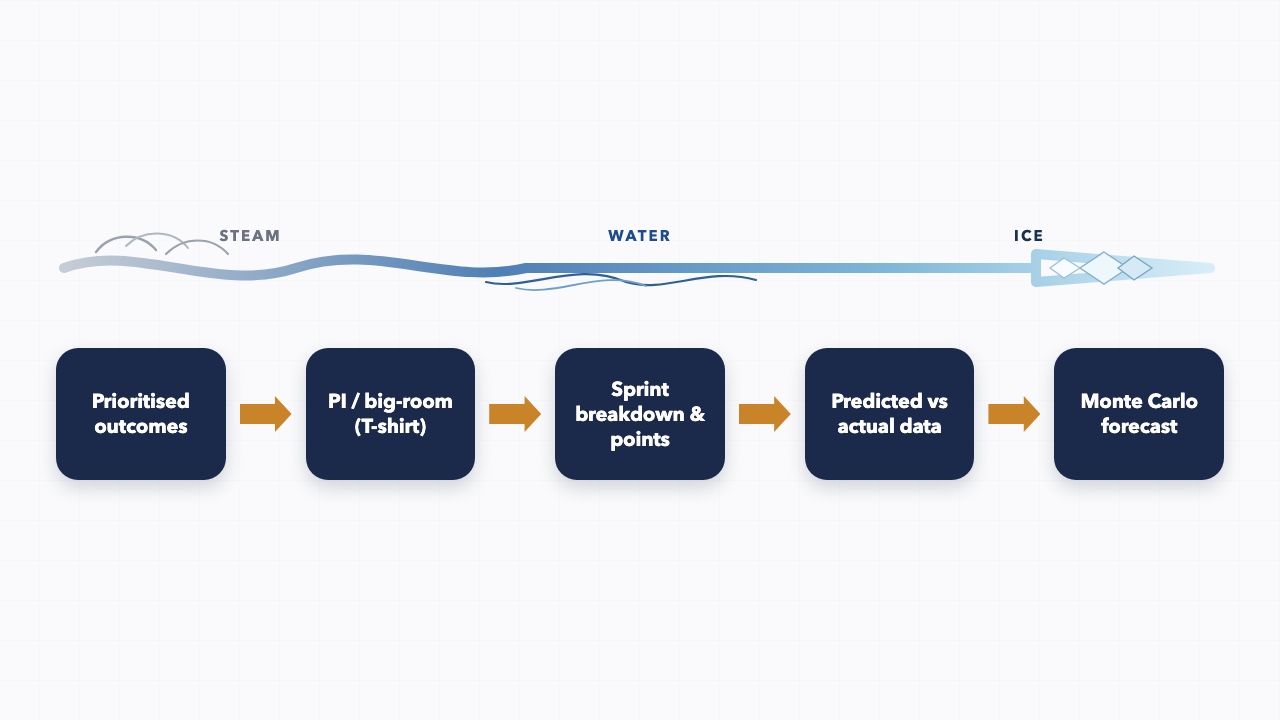
Keep the coarse plan and the fine plan connected. Outcomes that win PI slots must become backlog items with owners. Dependencies called out in the room must become tracked constraints, not slideware. When predicted and actual diverge, adjust scope or sequence first. Do not quietly rewrite history so the Gantt still looks green.
Forming teams versus forecasting teams
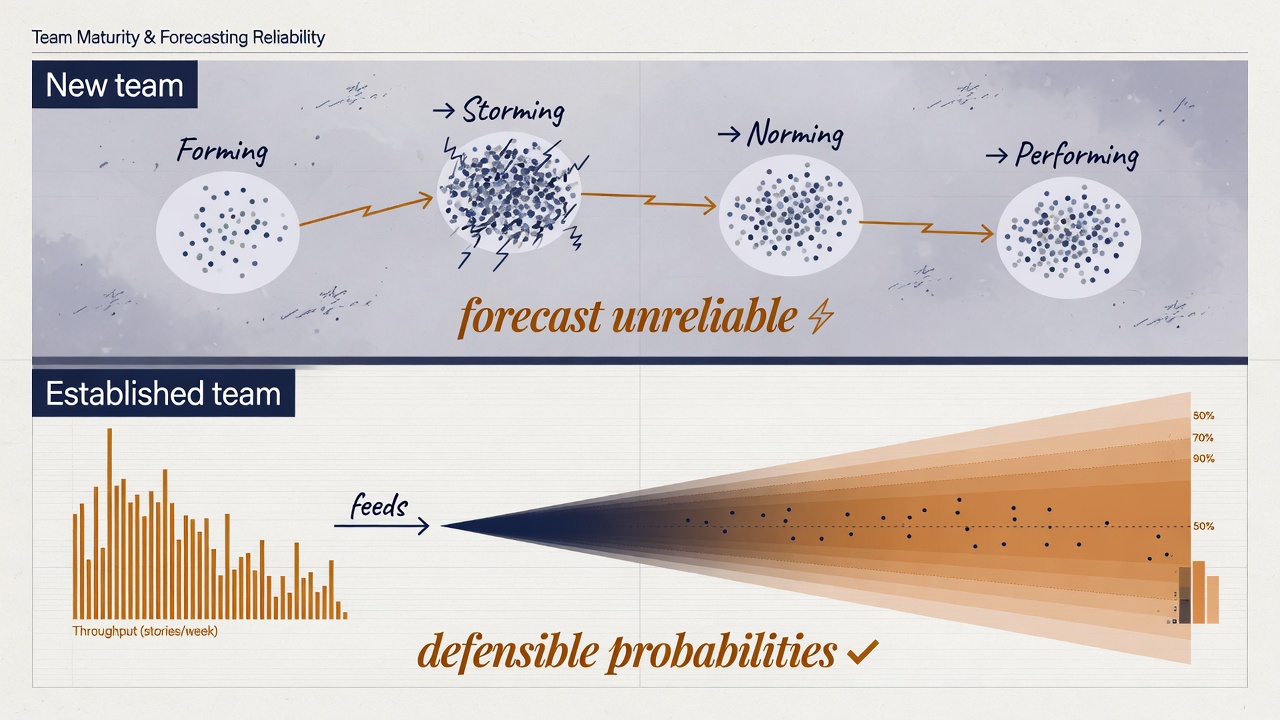
Tuckman is not a branding exercise. Forming and storming teams do not yet have a stable delivery signal. Norming teams start to. Performing teams with a few months of clean throughput (or points completed per sprint) can defend a probability statement.
Do not sell Bayesian theatre in month one. A new squad with rotating membership, unclear Definition of Done and a backlog still being invented will produce numbers that look scientific and mean little. Establish the operating system first: priority, feedback and consistent completion accounting. Then forecast.
Established teams are a different matter. Once you have a run of similar-sized work finishing under similar constraints, historical throughput is a legitimate prior. Monte Carlo sampling from that history answers "when" and "how much" better than a single velocity average. Optional Bayesian updates can tighten the picture as new sprints land, but only after the base data is honest. Until then, treat early forecasts as directional and say so.
Getting the data into the teams
Capture what finished, when it finished and at what size (if you use points). Capture start and finish dates for cycle-time views if you care about flow. Capture blocked time and dependency wait if cross-team friction is the real story. Hygiene beats tooling. A spreadsheet with honest done dates beats a Jira estate full of tickets moved to Done on the last day of the sprint to protect velocity optics.
Agree what "done" means and do not move the finish line to flatter the chart. Keep work item sizes roughly comparable or split outliers. Avoid gaming points. Tooling is secondary: ActionableAgile-style analytics, native Jira charts or a short Python notebook all work once the history exists. Budget roughly one to two months of clean execution before you treat the forecast as board-grade. That is not delay for its own sake. It is the minimum for the sample to stop being noise.
Data-driven forecasting: Monte Carlo (and Bayesian) without the mystique
Monte Carlo forecasting, in the form popularised for Agile delivery by practitioners such as Daniel Vacanti and the Actionable Agile tradition, is not mysticism. You take historical throughput (items or points finished per day or per sprint), sample from that history thousands of times and ask how often the remaining work would have finished by a target date. The output is a distribution, not a prophecy.
A short intuition sketch:
# remaining = work still to finish (items or points)
# history   = list of past throughputs per period (sprint/day)
# target    = number of periods until the date you care about
trials_done = 0
for trial in 1..N:          # e.g. N = 10_000
    remaining_sim = remaining
    for period in 1..target:
        remaining_sim -= sample(history)   # draw one past throughput
        if remaining_sim <= 0:
            trials_done += 1
            break
P(done by date) ≈ trials_done / N
If about 8,700 of 10,000 trials finish the remaining scope on or before Thursday, you say: feature X by Thursday with ~87 per cent confidence. That is the sentence boards can use. It is also the sentence that forces a scope conversation when the number is 40 per cent.
The cumulative view is the same idea in one line. Let \(T\) be simulated completion time under resampling of historical throughput. Then:
P(T \le t_{\text{Thursday}}) \approx \frac{1}{N}\sum_{i=1}^{N}\mathbf{1}[T_i \le t_{\text{Thursday}}]Optional Bayesian updates treat the latest sprint as new evidence that shifts your belief about throughput. Useful once the series is stable; decorative before that. Prefer throughput counts when you can: they drift less than points and connect cleanly to Little's Law style flow thinking. Points still work if the team's scale is consistent and you refuse inflation. Either way, the unit in the history must match the unit of remaining work.
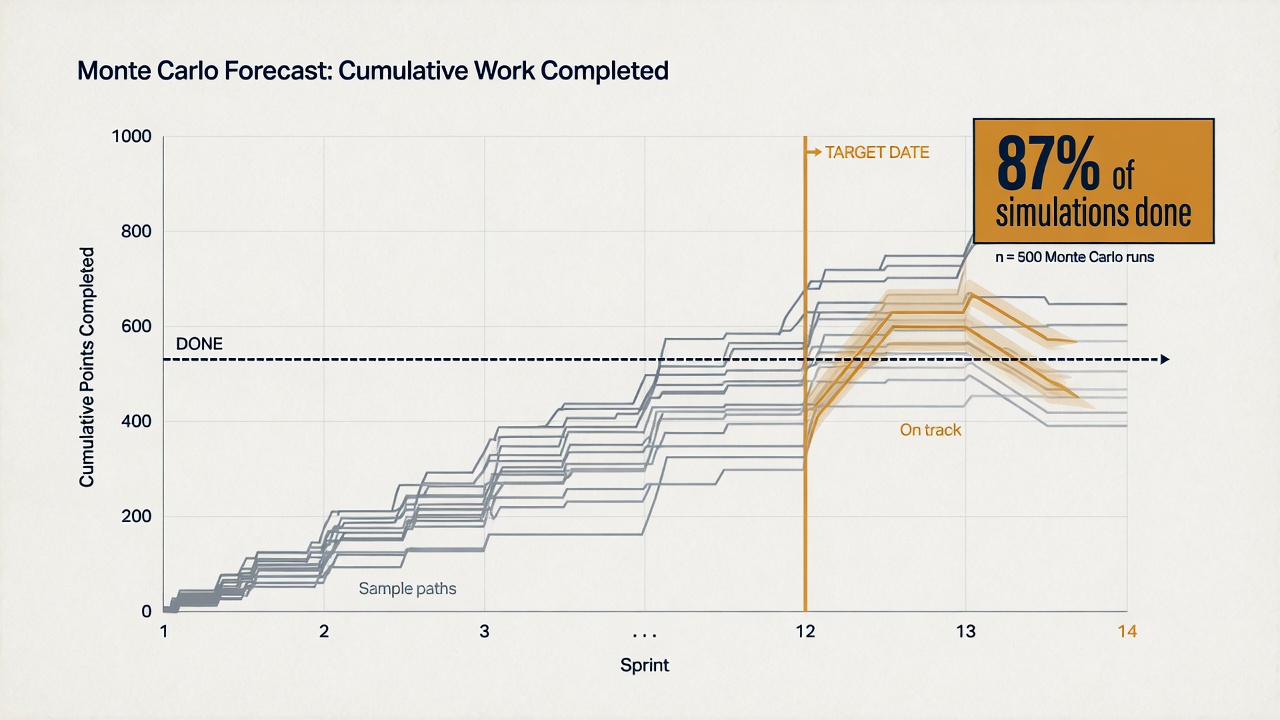
Public tooling write-ups (ActionableAgile documentation and related practitioner blogs) typically surface planning percentiles such as p50, p85 and p95: coin-flip, commit and sleep-at-night. An ~87 per cent example sits near the commit band many teams treat as board-safe. Treat vendor screenshots and percentile defaults as industry practice, not as a regulated standard.
Why this beats waterfall planning theatre
Waterfall planning theatre sells a single date and hides the contingency in buffers, overtime and quiet scope cuts. When the date slips, trust evaporates because the plan never admitted uncertainty. Probabilistic Agile sells the same calendar question with a band: here is what 50 per cent looks like, here is what ~87 per cent looks like, here is what you must cut or add to move between them.
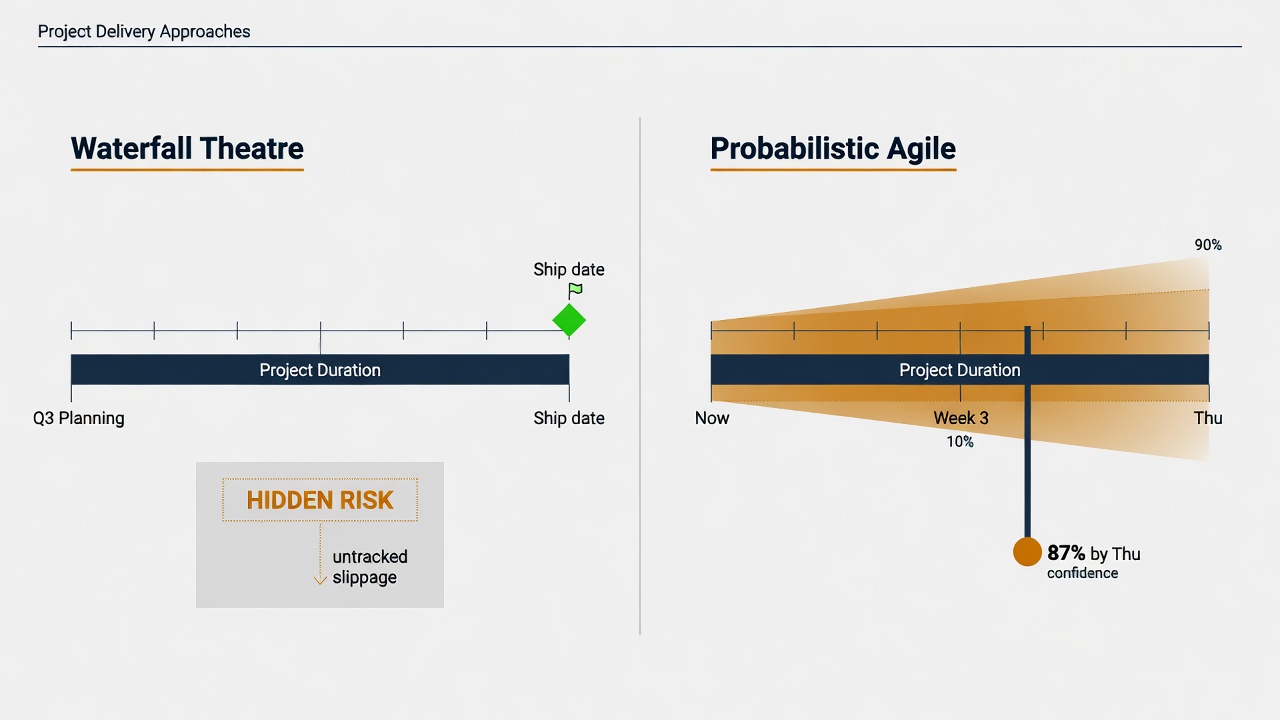
The second model is harder in the room for five minutes and easier for six months. Sponsors can choose risk. Product can trade scope for date. Engineering can show which dependencies move the percentile. Audit and risk get a trail: the forecast, the data window, the assumptions and the decision. That is adult governance. A Gantt that was always going to slip is not.
Caveats
Garbage points produce garbage probabilities. If story points inflate after every planning session, your Monte Carlo will confidently forecast nonsense. Fix the scale or switch to item counts.
Cross-team dependencies break naïve forecasts. A team that finishes its own stories on time still slips if a platform squad, a change window or a vendor sits on the critical path. Model the dependency explicitly or widen the confidence band until you do.
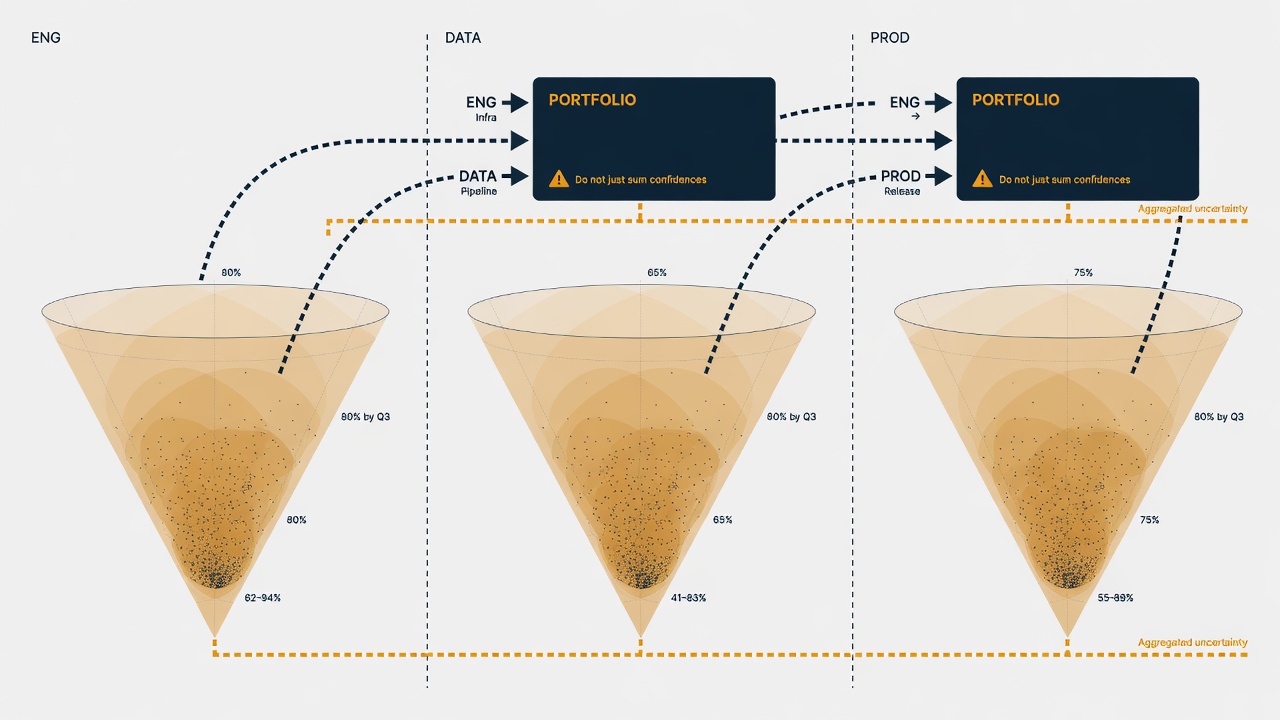
Portfolio roll-up is not "sum the confidences". Three teams each at 87 per cent on dependent slices do not yield an 87 per cent programme. Correlation and dependency structure matter. Roll up with a portfolio simulation or with explicit critical-path honesty, not with arithmetic optimism.
Ceremonies without priority still fail. Perfect throughput charts on a backlog that is not ranked will forecast the wrong work with impressive precision. Priority and feedback remain the operating system; Monte Carlo is the instrumentation.
A pragmatic rollout for a regulated organisation
Pick one established product team with a real outcome on the calendar, not a brand-new transformation squad. Instrument completion for four to eight sprints with agreed Done criteria. Keep PI or quarterly planning for coarse outcomes and T-shirt capacity; stop using it as a fake detailed schedule. Teach sponsors to ask for percentile commitments ("what date at ~85–90 per cent?") instead of a single silent date.
Stand forecasting beside existing governance rather than inventing a parallel cult. Risk and change committees still need dates; give them dated probabilities and the scope assumptions underneath. Document the data window, the sampling method and who may change scope when confidence drops. For new teams, publish directional ranges only and say when board-grade forecasting starts. Avoid tool sprawl: one analytics path, one definition of Done, one owner for forecast hygiene.
Banks and insurers already know how to talk about probability in credit, actuarial and operational risk. Delivery forecasting is the same intellectual move applied to throughput. The cultural block is not maths. It is the habit of treating a Gantt diamond as safer than an honest band.
Immediate next steps
Name the prioritised outcomes for the next ~90 days and kill duplicate P1s.
Pick one established team; freeze Done criteria; capture throughput or points completed for the next two months without gaming.
Replace the next board date ask with a percentile commitment: scope X by date Y at ~87 per cent (or show the cut required to get there).
Surface the top three cross-team dependencies that would invalidate the sample and assign owners.
Only then choose tooling; spreadsheet first is fine.
Refuse the date and you train the organisation to invent one without you. Fake precision and you train it to ignore you when the bar turns red. Probability commitments are the adult middle path: Agile changes how you plan and commit; it does not abolish either.